Amazon Prime Day 2023 Analysis: Sales and Advertising Results and Insights
Explore this exclusive report for an inside look at how brands and retailers performed during this year’s Amazon shopping event.By Marissa IncittiJuly 21, 2023
With Prime Day 2023 over, both customers and businesses can look back on a record-breaking sales event. It’s time to reflect on these staggering figures and highlight the categories that shone brightest amid inflation and economic uncertainty.
Below we’ll take a look at key data points and highlight the trends by examining the results from Feedvisor customer sales and advertising data across Amazon’s U.S. marketplace during Prime Day events from 2021–2023.
The first day of Prime Day, July 11, was the single largest sales day in company history, with $6.3 billion in sales.
Record-Breaking Total Sales
As a result of this shopping frenzy, Feedvisor’s vast array of clients saw success with an average 18% increase in total sales year-over-year. With our technology and support, they were able to strategically leverage Prime Day’s global enthusiasm to captivate a vast audience, driving remarkable growth. As millions of customers eagerly shopped and saved during Prime Day 2023, our clients’ businesses flourished, reinforcing their market positions and paving the way for greater prosperity ahead.
Nonetheless, Prime Day’s outstanding performance and overwhelming response from customers affirmed its position as the biggest shopping extravaganza, capturing the hearts and wallets of millions of shoppers worldwide.
Consumers Rejoice Over Irresistible Discounts and Deals
Part of that success was due to the highest satisfaction with deals in Prime Day’s history. Over half (66%) of consumers were extremely or very satisfied with the discounts offered.
Customers across the globe collectively saved more than $2.5 billion on deals. Steep discounts in electronics (peaking at 14 percent off listed price), apparel (12 percent), and toys (12 percent) enticed shoppers, alongside considerable savings on home/furniture (9 percent), computers (8 percent), appliances (7 percent), sporting goods (6 percent), and TVs (5 percent). With these irresistible deals at their fingertips, consumers made the most of Prime Day, reveling in the thrill of securing fantastic savings across an array of sought-after products.
Amazon introduced an “invite-only deal alert” program, which most likely contributed to consumers taking advantage of more deals this year than ever before. Prime members could request an invitation to score some of Prime Day’s best deals that were expected to sell out.
Top products include: Fire TV sticks, Apple AirPods, and Laneige lip balm
Top-Performing Categories
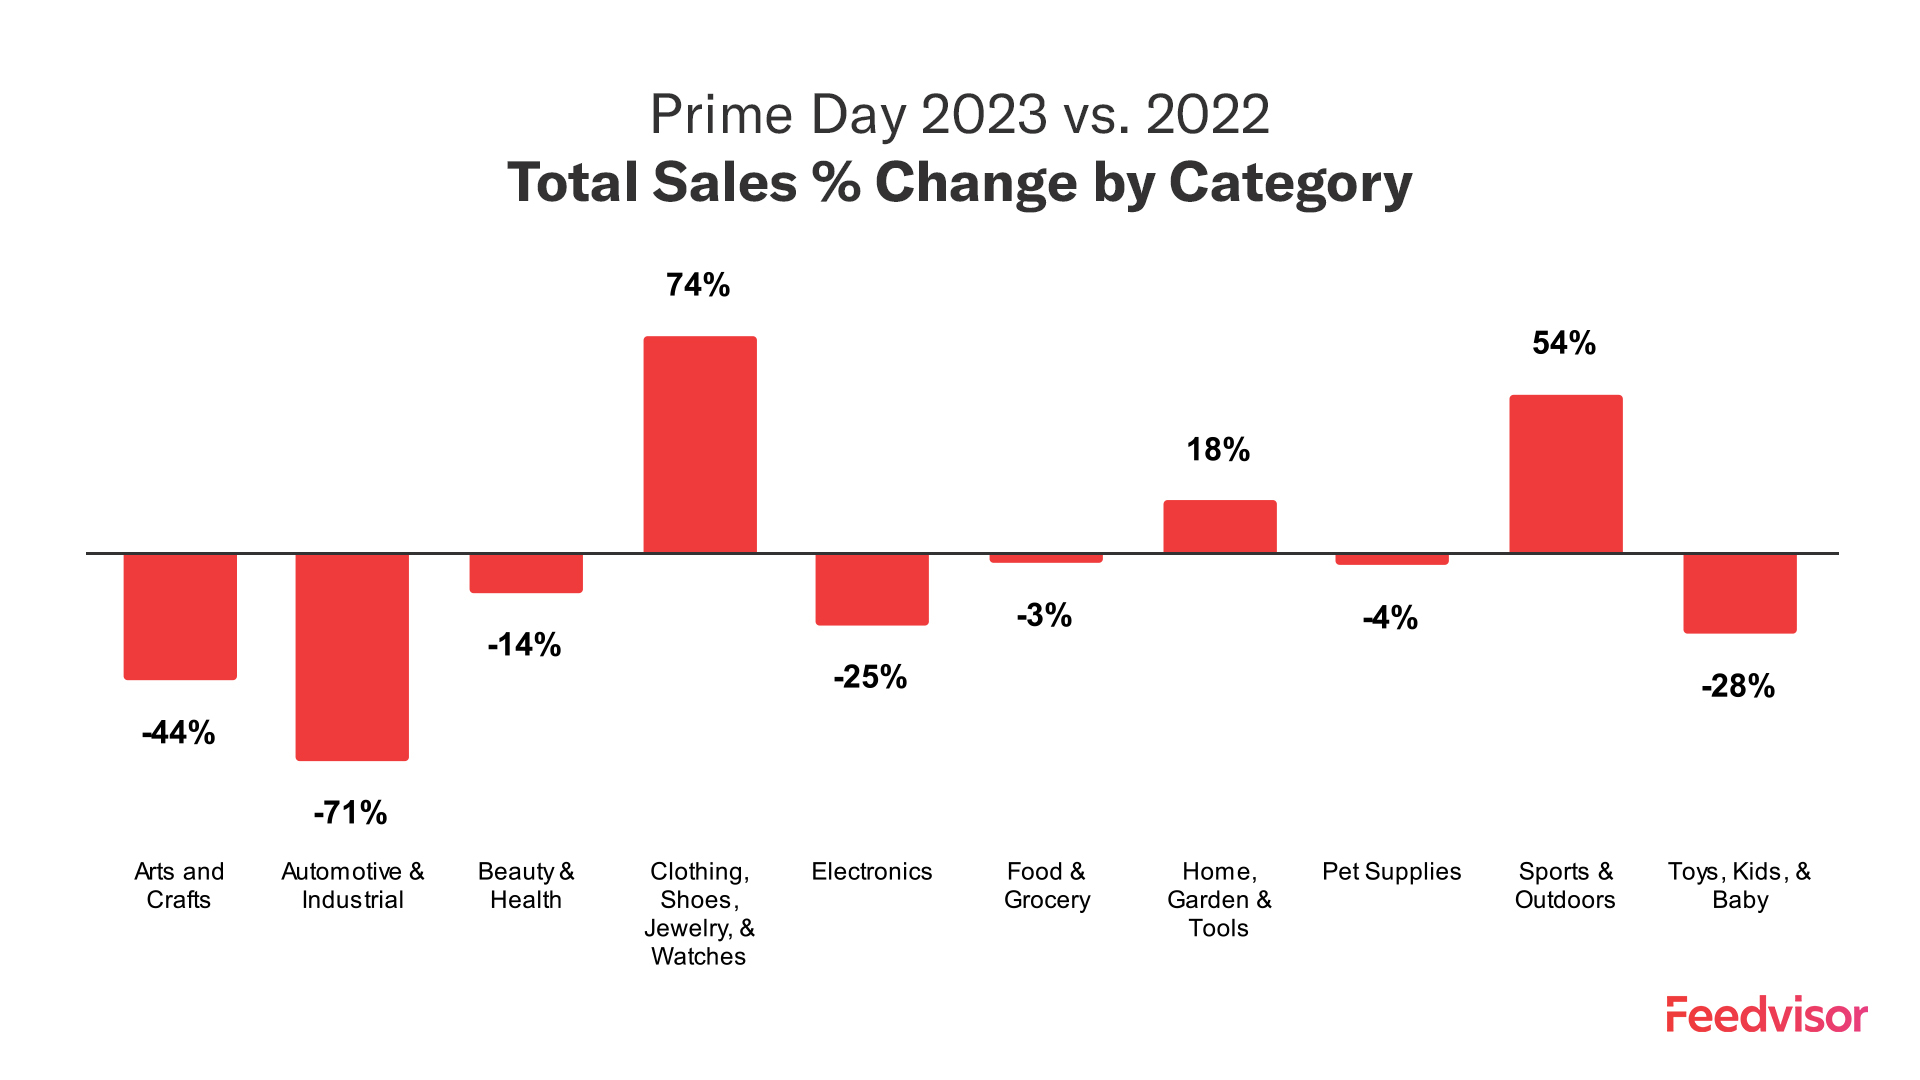
Feedvisor’s extensive data shows that Apparel, Sports & Outdoors, and Home & Garden were the most popular categories this year. These category winners are similar to what the market has reported, with Numerator showing the top three categories for sales being: Home Goods, Household Essentials, and Apparel and Shoes.
Apparel: Topping the charts, the Apparel category witnessed a staggering 74% increase in sales compared to the previous year. Shoppers clamored for the latest fashion trends and wardrobe essentials, taking advantage of enticing Prime Day offers.
Sports and Outdoors: Outdoor enthusiasts rejoiced as the Sports and Outdoors category experienced a significant 54% increase in sales. From fitness equipment to camping gear, customers seized the opportunity to enhance their outdoor experiences.
Home & Garden: The Home & Garden category saw a noteworthy 18% increase in sales. With deals on home decor, kitchen essentials, and gardening gear, customers flocked to elevate their living spaces.
Moreover, in light of the ongoing inflation and financial constraints faced by many households, 32% of consumers opted to buy the same essential items they typically purchase during Prime Day, but for discounted prices. This careful approach highlights the conscious decision-making of these shoppers, who prioritized meeting their essential needs while navigating the challenges posed by economic uncertainties.
The top-performing ads this year were Sponsored Product, Sponsored Brand, and Display
Feedvisor Clients See Explosive Growth in Ad Sales and Great Returns
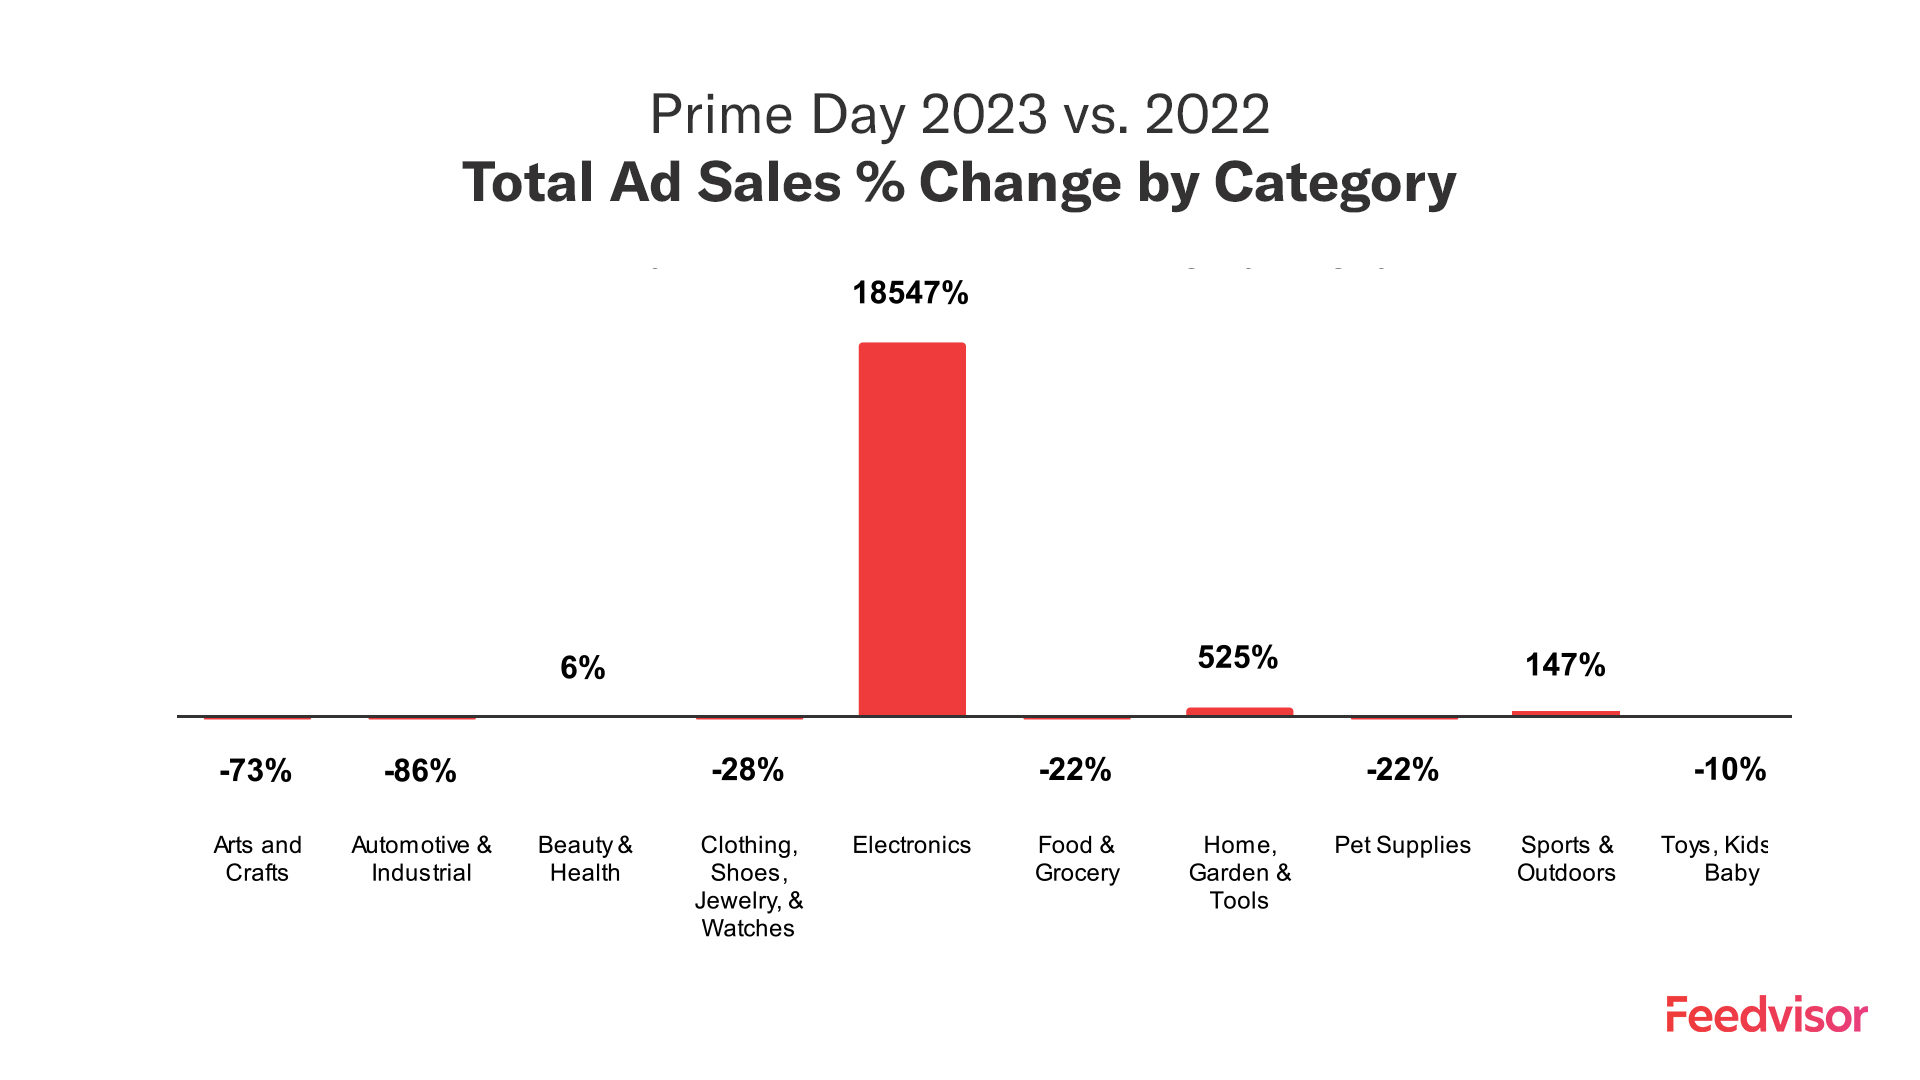
Prime Day 2023 also witnessed an explosion in advertising sales, indicating the growing importance of advertising during this sales extravaganza. The total ad sales from our cliets experienced an astonishing 1517.49% increase year-over-year, reflecting the eagerness of brands to capitalize on the shopping frenzy.The categories that witnessed the most substantial growth in ad sales are:
Electronics: The Electronics category dominated the advertising realm, with an eye-popping 18,547% increase in ad sales compared to the previous year. As customers sought cutting-edge gadgets and tech deals, advertisers vied for attention in this fiercely competitive space.
Home & Garden: Advertising in the Home & Garden category saw a remarkable 525% increase year-on-year. With homeowners on the lookout for home improvement products, advertisers seized the opportunity to showcase their offerings.
Sports & Outdoors: The Sports & Outdoors category witnessed a commendable 147% increase in ad sales, reflecting the demand for adventure gear and fitness products.
The Return on Ad Spend (ROAS) demonstrated a healthy 116.858% increase year-over-year, underlining the effectiveness of advertising during Prime Day 2023. Moreover, the Total Ad Spend recorded a noteworthy 525.671% increase, indicating the significant investments made by brands to capitalize on the event.
Decline in Ad Cost
While the overall advertising performance soared, our clients enjoyed a reduced cost of advertising during Prime Day 2023. The total Advertising Cost of Sale (ACoS) dropped 26.5% compared to the previous year. This reduction allowed brands to allocate their budgets more efficiently and maximize their returns.
Competitive CPC with a Marginal Increase
Although the overall advertising landscape was fiercely competitive, the Cost Per Click (CPC) remained manageable. At $2.32, the CPC experienced a reasonable 38% increase year-over-year. Despite the higher costs, our clients found value in reaching a massive audience and driving conversions during this peak shopping period.
Final Thoughts
Prime Day 2023 was an unparalleled success, shattering records with a remarkable $12.7 billion in total sales. Our clients experienced tremendous growth, with categories like Apparel, Home & Garden, and Sports and Outdoors taking center stage. Advertising witnessed explosive growth in sales and remarkable returns proving once again, that advertising is a must for those selling on Amazon. While the competition was intense, the efficiency of ad spend and manageable CPC proved the value of advertising during Prime Day.
As we bid adieu to Prime Day 2023, we eagerly anticipate the fall Prime event, Prime Early Access Sale (PEAS), brimming with potential for even greater success and prosperity for our clients and shoppers alike.
This recap was published on July 22, 2022. We keep our past years’ recaps online for future reference.
From the Archives: Prime Day 2022 Recap
The highly anticipated Prime Day event for 2022 has come and gone with mixed levels of success. While sales are expected to total $12.52 billion this year, the question on everyone’s mind is how much of the increase is due to consumer demand and how much is due to inflation?
What we currently know is the return to July was well received despite inventory and supply chain concerns. Amazon pulled out all the stops during the lead-in with early promotion of deals and use of influencers, including livestreams and social promotions.
Below we’ll take a look at how successful these strategies were by examining the results from Feedvisor customer sales and advertising data across Amazon’s U.S. marketplace during Prime Day events from 2021–2022, identifying key trends and KPIs to share our insights and projections for the remainder of the year.
Read on for more exclusive insights into this year’s Amazon Prime Day shopping event and discover how top brands and retailers are adapting their Prime Day strategies to keep up with the evolving e-commerce landscape.
Amazon Prime Day 2022’s Return to Summer Increased Sales
Prime Day has been held in three different months in the past three years, and while each year has had it’s own set of circumstances, the return to July has been met with great success.
Currently, July 12th was the biggest day for online spending to date in 2022, totaling over $6 billion, and surpassing the total online sales for 2021’s Thanksgiving Day.
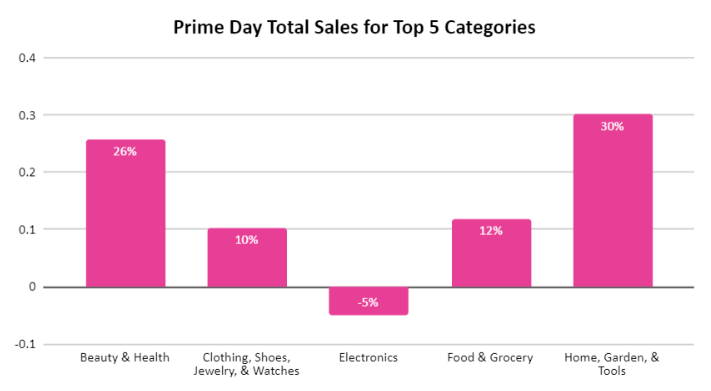
According to Feedvisor data, the top 3 categories by sales are Home & Garden, Beauty & Health, and Food & Grocery. When compared to last year, the Home & Garden category saw the highest increase in total sales (by 30%), while Beauty & Health saw an impressive 26% increase when compared to last year.
Inflation and Increased Competition Drives Ad Spend and RoAS Up
Politico just released a statement showing inflation has reached 9.1% as of June – the highest rate in 40 years. No one is immune to its effects as consumers, sellers, retailers, and brands are all dealing with the ramifications of increased costs. Some businesses have chosen to raise their prices, while others have tried to offset the cost with deals and promotions. Whichever route they chose, Amazon sellers faced fierce competition as they tried to convince reluctant consumers to purchase their products over others.
Between inflation and the increased competition, ad spend rose 31% compared to last year, with a majority spent on the first day of Amazon Prime Day. Ad sales increased by 1073% over the previous year, indicating that the ad spend was worthwhile.
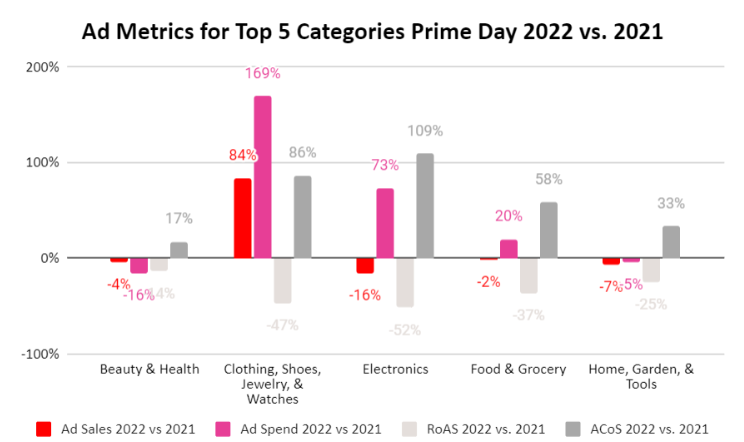
The Clothing, Shoes, Jewelry & Watches category had the highest percentage of sales from ads at 84%. This category also had the highest ad spend compared to previous years (169% increase), but the return on ad spend dropped 47%, showing the immense competition that sellers faced this year. Ad cost of sale (ACoS) increased by 86% increase, but not as high as the Electronics category, which increased by 109%.
Across the top 5 categories, ACoS increased 49% when compared to Prime Day 2021, while RoAS increased 93%. The trend in upward movement shows despite the fierce competition many sellers faced advertising, those who increased their ad spend saw higher returns. Those who did NOT increase their ad spend also saw a bump in sales and impressions:
“We decided against advertising for specific Prime Day deals since, in the past, we haven’t seen much return. This year, we were pleasantly surprised to see an increase in sales and a new customer base, despite not advertising at all.” – Zhenjing Xiao Co-Founder, Illustrious Apparel Company
CPC Skyrockets Overall, But Stays Below Average for Top 5 Categories
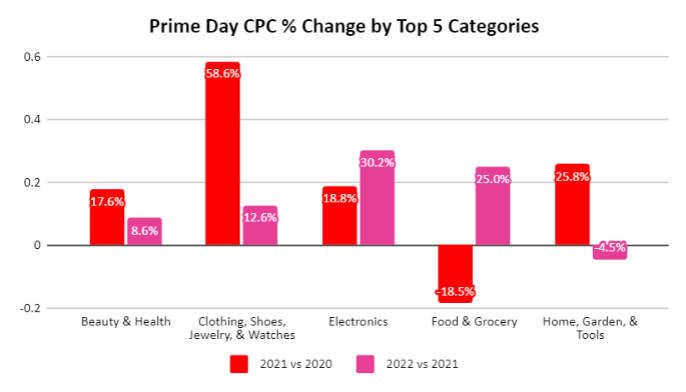
While normally a historically competitive selling period, Prime Day sales came at a much higher cost due to escalating costs per click (CPCs) and costs per impression (CPM). Across categories, CPCs increased by 123% for Amazon Prime Day 2022 compared to 2021, while they increased modestly, by 29%, in 2021 compared to 2020.
The Electronics category saw the highest increase in CPCs by 30% this year, while returns on advertising spend (RoAS) decreased by 52%. Total RoAS across categories, however, increased by an impressive 93% during this year’s event compared to 2021.
Brand Awareness Soars as Impressions Climb
Impressions increased 169% across all categories when compared to last year and were significantly higher on the first day of Amazon Prime Day (July 12). Clothing, Shoes, Jewelry, & Watches saw the highest increase in impressions, up 413% from the previous year. Despite the increase in ad spend and ad sales, Beauty & Health received fewer impressions than in 2021 (down 0.9%).
Final Thoughts
It was a difficult year for brands and retailers as they had to adjust their strategies to deal with rising supply chain costs, the highest inflation rates in history, and any other issues that impacted their businesses. These factors may have discouraged businesses from investing heavily in Prime Day promotions.
Feedvisor Amazon expert and Advertising Manager, Managed Services Team Lead Ashley Mohan says that this year, many sellers chose to diversify their advertising efforts by strategically investing in Prime Day and placing a greater focus on longer-term ad spend investments in order to better prepare for the crucial Q4 holiday shopping season.
With the Fall Prime Day event and holiday promotions as the next big events retailers and brands are preparing for, make sure your business has the most advanced technology and team of experts available to help with your Q4 pricing and advertising strategies.
Stay on top of the latest e-commerce and marketplace trends.
Third-party sellers saw a 100% year-over-year sales increase during Prime Day 2021, according to Amazon.
This recap was published on Jun 24, 2021. We keep our past years’ recaps online for future reference.
From the Archives: Prime Day 2021 Recap
After facing last year’s pandemic-related challenges, 2021 marks a bit of a return to normalcy for brands and retailers, with Amazon’s annual Prime Day event back to its traditional summer schedule.
Despite its summer return, Prime Day was held earlier than usual this year. The move to June was in part influenced by the fact that July is a typically busy month for family vacations and, this year, will also feature the start of the Olympics. Amazon also likely moved up the dates out of anticipation for continued supply-chain issues related to the pandemic.
How did the event’s new date impact consumer behavior? More important, what impact did these factors have on brands and sellers, in terms of both their approach to the event and their performance?
Overall, businesses certainly experienced growth with their Prime Day efforts, with the first day of the 2021 Amazon event driving the most online sales in a 24-hour period so far this year. In particular third-party sellers saw a 100% year-over-year sales increase and had the biggest two-day selling period yet during Prime Day 2021, according to Amazon.
However, early data indicates that the results from this year’s event were modest compared with past years’ events. Concerns over supply-chain issues coupled with the shift away from last year’s October dates — which coincided with the start of the Q4 holiday shopping season — have made a noticeable impact on Prime Day 2021 results.
In this report, we examine Feedvisor customer sales and advertising data across Amazon’s U.S. marketplace during Prime Day events from 2019–2021, identifying key trends and KPIs to share our insights and projections for the remainder of the year.
Read on for more exclusive insights into this year’s Amazon shopping event and discover how leading brands and retailers are adapting to the changing Prime Day and e-commerce landscape.
Electronics category ad sales grew by 47.4% in 2021 versus 2020, on par with its 48.8% growth in 2020 versus 2019, per Feedvisor data.
Increased Competition Drives Higher Cost of Sales
Another challenge brands and sellers had to face this year was the increase in competition over Prime Day advertising. According to Feedvisor customer data, ad spend was up 93.6% during Prime Day 2021 compared to 2020, while it was only up 43.7% for 2020 versus 2019.
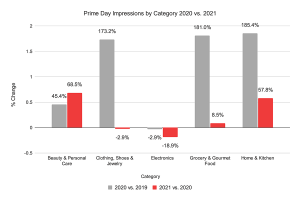
Additional key indicators of the change in consumer behavior this year are impressions, which were much lower compared to last year. Overall, impressions only grew 32.5% in 2021 versus 2020, while they increased by 74.7% for 2020 compared to 2019.
In particular Clothing, Shoes, and Jewelry saw impressions decline by 2.9% this year, while they grew by an astonishing 173.2% the year prior. Electronics experienced a dip as well, seeing impressions fall by 18.9% for Prime Day 2021.
Although overall impressions did not grow as fast in 2021 versus 2020, the Beauty and Personal Care category continued its positive trend, seeing impressions rise by 68.5% in 2021 compared to 2020, while it grew by 45.5% for 2020 versus 2019.
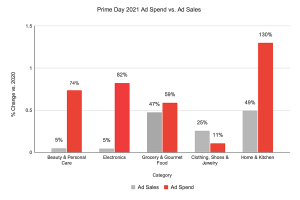
Still, increased advertising investment helped brands and retailers drive Prime Day returns. Ad sales were up 25.7% across categories this year, a strong follow up after seeing ad sales grow by 35.9% in 2020 compared to 2019. In particular, the Electronics category performed well again this year, with ad sales growing by 47.4% in 2021 versus 2020, on par with its 48.8% growth in 2020 versus 2019.
Home and Kitchen ad sales also grew by 49.2% in 2021 compared to 2020, following a 49.3% increase for 2020 versus 2019. The continued growth of ad sales amid rising ad spend is a testament to how essential advertising has become to effectively compete on Amazon’s marketplace. Indeed, only those who invest heavily in their advertising strategies are seeing strong sales results. Make sure you have a solution in place that will maximize your ad performance like Feedvisor’s “AI-first” optimization platform and team of Amazon 1P and 3P experts.
An historically competitive selling period, Prime Day sales came at a higher cost due to escalating costs per click (CPCs) and costs per impression (CPM). Across categories, CPCs increased by 28.6% for Prime Day 2021 compared to 2020, while they fell by 13.6% in 2020 compared to 2019.
However, the Grocery and Gourmet category did see CPCs fall by 18.9% this year, while returns on advertising spend (RoAS) increased by an impressive 44%. Total RoAS across categories, however, declined by 18.3% during this year’s event compared to 2020.
The stunted growth again shows the power of Prime Day coinciding with last year’s Q4 holiday shopping season, and its effects on consumer behavior.
Prime Day 2021 Sales Show Modest YoY Growth
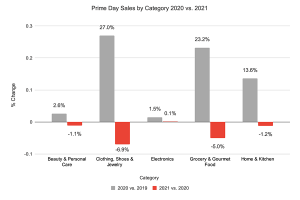
Following an impressive 2020 event, which brought in $3.5 billion in sales for third-party sellers, Prime Day 2021 sales did not grow as fast as the year prior. According to Feedvisor customer data, Prime Day total sales were up just 0.3% in 2021 versus 2020, while they grew 5.2% in 2020 compared with 2019.
While Clothing, Shoes and Jewelry dominated during last year’s Prime Day, increasing total sales by 27% in 2020 versus 2019, the category’s total sales decreased 6.9% in 2021 compared to 2020. Electronics also experienced a dip, growing total sales by 1.5% in 2020 compared to 2019, while only growing by 0.1% in 2021 versus 2020.
This data indicates these categories benefited from the event occurring during the Q4 holiday shopping season last year, a critically important selling period for brands and retailers. This year, the numbers fell flat with Prime Day’s return to summer, while the move to June may have been a strategic decision by Amazon to avoid the usually slower selling months later in the summer.
According to 2020 Feedvisor consumer research, nearly 64% of consumers started their holiday shopping last year on or before Prime Day. In addition, 36% of consumers said they expected to find the best 2020 holiday deals on Black Friday. Since this year’s event fell well before the holiday season, major holiday categories like Electronics and Clothing, Shoes, and Jewelry likely did not get a boost from any early gift-buying behavior.
Instead, consumers likely focused more on back-to-school items this year, with Amazon noting that its more than 200 million worldwide Prime members purchased more than 600,000 backpacks, 240,000 notebooks, and 220,000 Crayola products.
Marissa Incitti is the Associate Director of Content for Feedvisor, where she oversees and executes the company's content marketing strategy and initiatives. Before joining Feedvisor, she was the content marketing manager for a Fortune Global 500 omnichannel commerce technologies and operations company.
Final Thoughts
Not only did brands and retailers have to adjust their strategies for the shift in dates and consumer behavior, but they also had to account for the rise in supply chain costs, as well as any issues that affect their inventory and ability to meet demand. These factors may have led businesses to shy away from investing heavily in Prime Day promotions.
Feedvisor Amazon expert and Associate Director of Managed Services and Strategic Accounts Alex Lannigan says that, while sellers still ran coupons and sured up inventory levels to capitalize on increased traffic during Prime Day, this year, many scaled back because of higher costs, instead focusing their efforts on preparing for the critical Q4 holiday shopping season.
As brands and retailers start to think about how they will attract holiday shoppers this year, make sure your business has the most advanced technology and team of experts in place who can help you get the most out of your Q4 pricing and advertising strategies.
Learn what Feedvisor can do for your business.
When you partner with Feedvisor, you automatically receive access to our true, AI-driven technology and hands-on team of e-commerce experts. Contact one of our team members today to learn more about our end-to-end solution for brands and large sellers on Amazon, Walmart, and e-marketplaces.
This site uses functional cookies and external scripts to improve your experience.
You may change your settings at any time. Your choices will not impact your visit.