Categories
Latest Posts



Tags
Advertising Amazon Amazon Advertising Amazon Experts Amazon Listing Optimization Amazon Marketplace Amazon News Amazon Prime Amazon Professional Sellers Summit Amazon Seller amazon sellers Amazon Seller Tips Amazon Seller Tools ASIN Brand Management Brands Buy Box Campaign Manager Conference COVID-19 downloadable Dynamic Pricing Ecommerce FBA FBM Holiday Season industry news Multi-Channel Fulfillment Optimize pay-per-click Pricing Algorithm Pricing Software Private Label Profits Repricing Repricing Software Revenue Sales Seller Seller-Fulfilled Prime Seller Performance Metrics SEO SKU Sponsored Products Ads Strategy
Get the latest insights right in your inbox
Resource | Blog
Prime Day 2026 Results: Growth Continued, But Profitable Growth Got Harder to Earn
- July 9, 2026
By: Marissa Incitti
Adobe reported $26.4 billion in U.S. online sales during Prime Day 2026, making this year’s event the largest summer e-commerce event on record and a 9.3% increase year over year. Amazon’s decision to move the event into June, in part to dodge calendar collisions with the FIFA World Cup and America’s 250th anniversary celebrations, and maintain the four-day format helped generate another record-breaking shopping event.
But as with any story, the headline sales numbers only tell one part.
Feedvisor analyzed Prime Day 2026 performance across thousands of Amazon brands to understand what actually changed beneath the surface, and can be summed up as healthy demand at lower selling prices.
Across the industry, consumers continued to buy, but they increasingly waited for promotions, compared prices across retailers, and prioritized value. The result was another year of revenue growth, though at a more modest pace than previous Prime Days, accompanied by significantly lower average selling prices across many purchases.
For brands, that created a very different operating environment. Sales continued to climb, but maintaining profitability became more difficult as discounts deepened, advertising costs rose, and lower-priced purchases made up a larger share of orders.

Marissa Incitti
Revenue Grew. Pricing Pressure Intensified.
Across Feedvisor customers, sales increased 25% year over year while units sold rose 29%, demonstrating that shopper demand remained healthy throughout the event. Average order value declined 5.8%, however, indicating that growth was increasingly driven by volume rather than higher-priced purchases.
Industry data tells a similar story. Adobe reported record online sales, but Numerator found average order values and spend per item fell meaningfully year over year as shoppers gravitated toward lower-priced products and everyday essentials.
The average order size came in at roughly $47.66, down about 11% from $53.34 during the same stretch of Prime Day 2025. Average household spend fell to $143.45, down 8% year over year. Spend per item dropped to about $23, continuing a multi-year decline from $28 in 2024 and $24.59 in 2025.
Rather than abandoning Prime Day, consumers became more selective about where they spent, using the event to replenish planned purchases while reserving larger discretionary spending for only the strongest promotions.
In fact, household essentials, health products, beauty items, and everyday consumables dominated shopping baskets, while consumer electronics represented a smaller share of purchases than in previous years. Numerator found only 14% of Prime Day shoppers purchased electronics, down five percentage points year over year, with many of the event’s best-selling products consisting of everyday staples like protein shakes, electrolyte packets, and household essentials rather than big-ticket purchases.
A Wrinkle Worth Noting: Not Everyone Traded Down
The picture isn’t entirely one of thrift, and it’s worth resisting the temptation to flatten it into a single narrative. Adobe’s category-level data found that the share of the *most expensive* products sold actually grew 19% compared to average 2026 levels, with premium electronics purchases up 51% and shoppers trading up in toys, appliances, and furniture. Retail Dive, citing Adobe, attributed part of this to Prime Day’s new June date overlapping with Father’s Day and back-to-school prep, which may have pulled some bigger-ticket gift and household purchases forward.
So the honest read isn’t “shoppers spent less across the board.” It’s closer to a barbell: heavier volume at the cheap end, driven by replenishment, alongside a smaller but real pocket of shoppers trading up on the handful of purchases they’d actually been waiting to make. Numerator found nearly half of buyers said they bought something they’d specifically been holding off on until it went on sale, patience, not austerity, seems to be the operative behavior.
Conversion Became the Difference Between Growth and Profitability
Third-party spending reports explain how much consumers spent during Prime Day. Feedvisor’s data offers a different perspective: what separated brands that simply generated more orders from those that did so efficiently.
Demand was stronger. Brands sold 29% more units and generated 25% more revenue than last year. But they also faced a more competitive advertising environment. Impressions increased 44% year over year, while average CPC rose 13.5% and CPM climbed 11%, making shopper attention more expensive to capture.
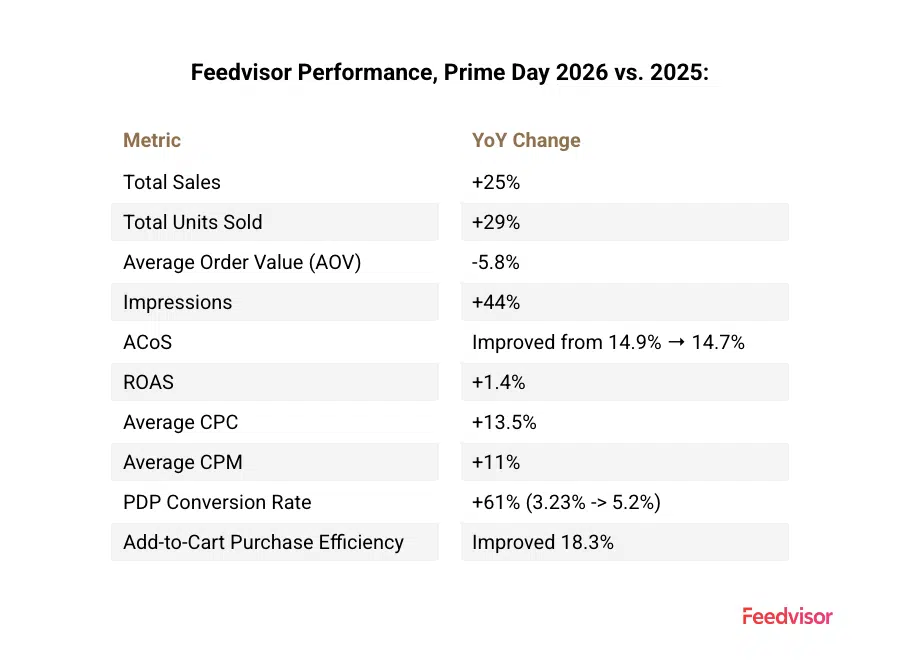
The data highlights an important shift. Brands generated more revenue, but they did so by selling more units at lower average selling prices while paying more to acquire traffic. In other words, growth came with greater pressure on margins.
What prevented those higher costs from eroding performance was conversion.
Product detail page conversion increased 61%, rising from 3.23% to 5.20%, while add-to-cart purchase efficiency improved 18.3%. Once shoppers reached a product page, they were significantly more likely to complete a purchase than they were a year earlier. That improvement helped offset rising media costs and softer pricing, allowing advertising efficiency to remain remarkably resilient despite a much more competitive environment.
Where The Ad Dollars Actually Went
Feedvisor’s category breakdown adds a layer of granularity that spend estimates from Adobe or Numerator don’t capture, since those sources track purchases, not advertising behavior. A few patterns worth noting:
Share of ad-attributed sales, top categories:
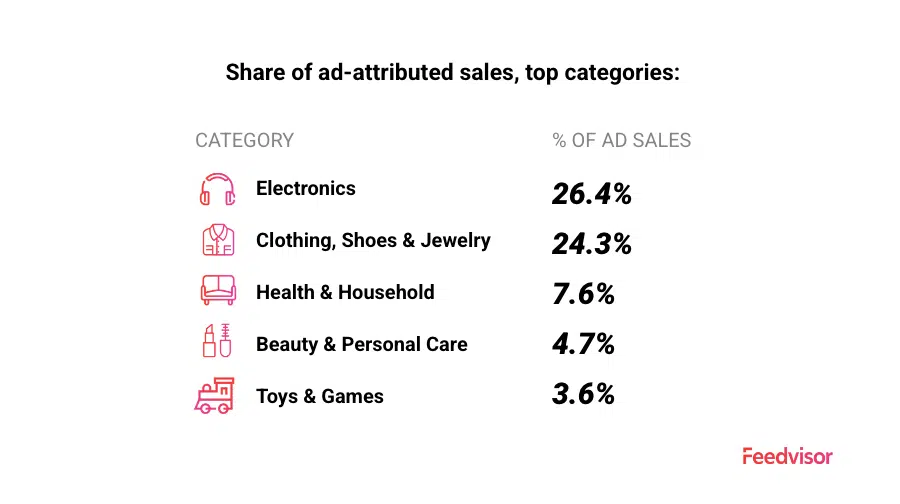
The top 10 categories accounted for roughly 80.6% of all ad-attributed sales, with Electronics and Clothing alone generating over half.
That’s a notable contrast with what Numerator found on the organic purchasing side, where electronics demand was actually contracting. The gap makes sense once you separate ad-driven sales from total category sales: Electronics carried real weight in *advertised* purchases, but that’s partly a function of where sellers concentrated spend, not necessarily a sign the category was thriving overall. Clothing, Shoes & Jewelry tells a similar but more extreme story on the cost side; it consumed 29.4% of ad spend and 53.1% of all impressions, more than five times its nearest competitor for impression share, while converting into “only” 24.3% of ad sales. That’s a category where sellers bought a lot of visibility relative to what it returned, likely reflecting how crowded and competitive apparel advertising has become on Amazon.
By contrast, Health & Household punched above its weight: it drew 20.3% of ad spend but returned a comparatively modest 7.6% of ad sales share, suggesting sellers in that category were paying a premium to compete for a shopper who, per Numerator, was buying more essentials than ever, just not necessarily converting through paid placements at the same rate.
Sponsored Display Was The Quiet Outperformer
Breaking ad effectiveness down by placement type shows why format mix matters as much as category:
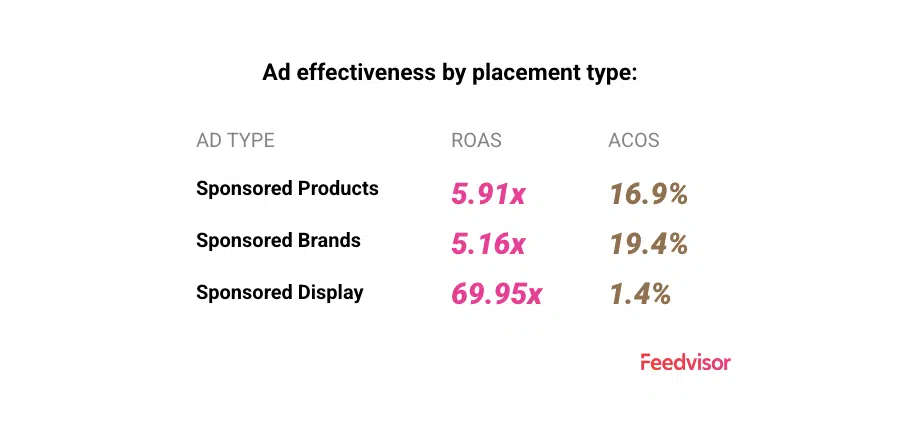
Sponsored Products remained the primary revenue driver by volume, but Sponsored Display posted a return more than ten times higher than either of the other formats, a 69.95x ROAS at just 1.4% ACoS. That efficiency almost certainly reflects a small retargeting audience already primed to buy, not cold discovery, so it should be read as a signal of where these shoppers were in the funnel rather than a scalable benchmark: pour budget into it and the return likely won’t hold. Still, for sellers reassessing budget allocation for Black Friday, that gap between Sponsored Products’ scale and Sponsored Display’s efficiency is worth a second look.
On the keyword side, Feedvisor’s data pointed to the strongest converting search intent clustering around consumer electronics accessories, children’s footwear, household cleaning products, personal care brands, home organization, and cycling accessories, a mix that again splits between “everyday restock” and “specific item I was already looking for,” rather than broad, exploratory browsing.
Numerator’s survey supports the same intent-driven read from the demand side: satisfaction with this year’s deals actually declined (roughly six in ten shoppers called themselves very satisfied, down from 67% in 2025), and only 41% said Prime Day was their primary reason for shopping on Amazon that week, down from 52% the year before. Fewer people were shopping *because* it was Prime Day; more were shopping with a specific list and using Prime Day as one comparison point among several. More than half of Numerator’s respondents said they compared prices across retailers during the event, and Walmart, Target, and club retailers all captured meaningful cross-shopping.
Amazon’s Pricing Crackdown Is The Quiet Variable
One development that’s easy to miss in the topline numbers: Amazon significantly tightened its rules around reference pricing earlier this year. Starting April 23, 2026, a “List Price” (the crossed-out price next to a discount) only qualifies for display if it reflects a price the item actually sold for elsewhere recently, or was purchased on Amazon itself at that price as the Featured Offer. A second change, effective May 18, altered how Amazon calculates “Typical Price” for items that had been discounted more than half the time over a 90-day window, folding promotional sales back into the reference-price math instead of excluding them.
In plain terms: Amazon closed a loophole that let sellers inflate a “was” price to manufacture the appearance of a bigger discount. Notably, Amazon carved out peak sales events, including Prime Day, from part of this recalculation, but the broader effect on seller behavior likely still bled into the event. Sellers who’d built strategies around near-permanent “sales” had to either substantiate their reference prices with real sales history or drop the strikethrough pricing altogether, which industry coverage of the rule change noted could directly affect how much a discount appears to be worth to a shopper.
It’s hard to isolate the exact size of that effect on Prime Day conversion, but the timing lines up: a market where discount claims had to be earned rather than declared, arriving right as shoppers were already reporting lower satisfaction with deal quality generally. Cleaner pricing information plausibly gave the remaining discounts more credibility, even as the total number of “big” discounts on offer likely shrank.
What This Means Heading Into The Back Half Of The Year
Prime Day 2026 demonstrated that consumer demand remains resilient. Revenue continued to grow, shoppers remained engaged, and brands that executed well generated meaningful sales gains. But the event also reinforced a shift that’s becoming increasingly difficult to ignore: growth is becoming more expensive.
Lower average selling prices, higher advertising costs, and increased price transparency are putting greater pressure on margins. Simply driving more traffic or spending more on advertising is no longer enough to guarantee profitable growth.
The brands that outperformed during Prime Day weren’t necessarily the ones offering the deepest discounts, but the ones that converted demand more efficiently. Strong product detail pages, credible pricing, relevant advertising, and disciplined retail execution helped offset rising acquisition costs and softer selling prices.
As brands head into the second half of the year, and toward Prime Big Deal Days, Black Friday, and Cyber Monday, the opportunity is to maximize the profitability of the demand that’s already there.