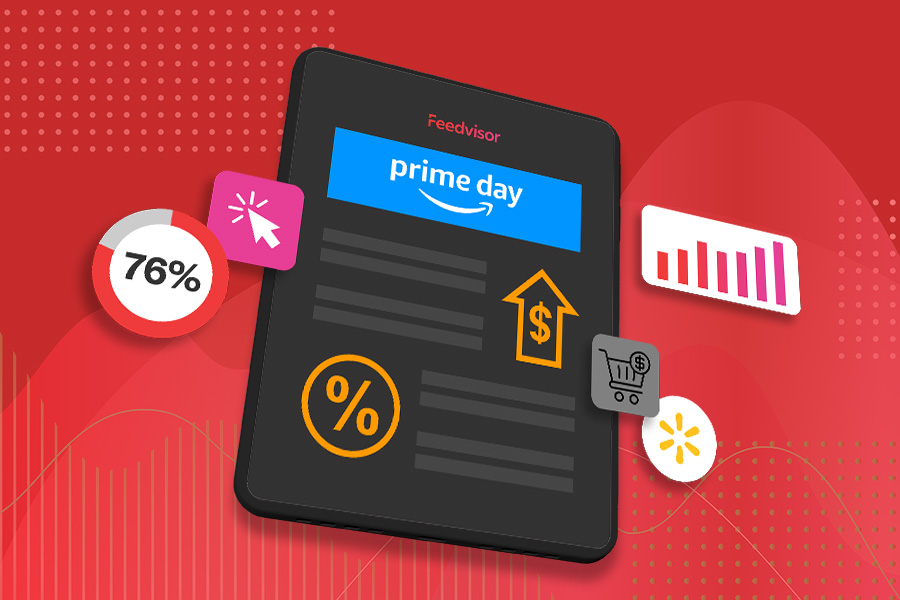
Prime Day and Other Summer 2025 Event Results at a Glance
Get all the top Prime Day and Summer Event data you need to know at a glance:
How shoppers spent across devices, days, and categories
Total sales and growth-rates that defined the record-breaking season
The fastest-growing product categories you can’t afford to miss
Download the Infographic
Prime Day and Summer Sales Events raked in $24.1 billion: proof tariffs and tight budgets aren’t holding shoppers back.
The numbers tell the story. Download our infographic to get all the key highlights at a glance—see where shoppers spent, which products drove the biggest gains, and how spending held strong despite economic pressures.
Inside, you’ll find:
Key summer event sales figures and growth trends
Breakdowns by day, device, and shopper behavior, showing where and how people shopped
The impact of tariffs and budgets on purchase decisions
Daily deal discount breakdowns showing how brands capture shifting demand
Top category performers and standout sales increases to watch