Feedvisor CTO Eyal Lanxner explores the increasing volatility of prices on the Amazon Marketplace and specifically within the Buy Box.By Eyal LanxnerOctober 16, 2017
Stay on top of the latest e-commerce and marketplace trends.
About the Author
Eyal Lanxner is CTO and co-founder at Feedvisor. He served as head of VeriSign’s research and analytics and as CTO at Zoomix Data Mastering. Eyal holds a M.Sc. in computer science from Bar-Ilan University.
The year 2016 concludes another revolutionary year for eCommerce. One of the most impressive phenomenon is the pace at which marketplaces are developing, specifically Amazon’s. A good indication of this is the increasing volatility of prices on the Amazon Marketplace and specifically within its Buy Boxes. In this article, I’ll share some related insights derived from a recent analysis we’ve conducted, covering several million products sold on Amazon.
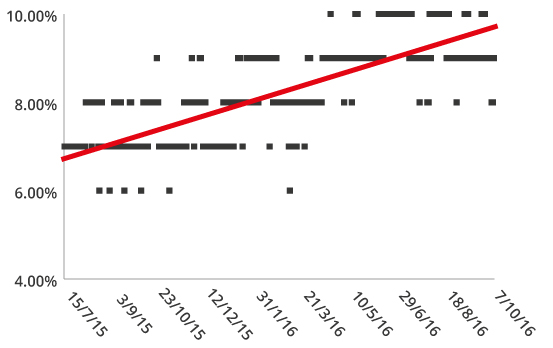
In our analysis, we’ve followed the price movements occurring within each of the products’ Buy Box over time. The following diagram summarizes these data points, reflecting the average rate of daily price changes within the Buy Box over the past 12 months. The X axis represents time, while the Y axis notes the average percentage of samplings in which we’ve identified a price change in the Buy Box, for all analyzed products (i.e. Buy Box price in sample t was different than Buy Box price in sample t-1). Looking at the trend line associated with all points, we can clearly see an increasing movement in this metric during the past year:
Similarly, we have measured the rate at which Buy Box owners are exchanged over time – i.e. the seller holding the Buy Box in sample t is different than the one holding it in sample t-1. Here as well we can see an inclining trend in the average number of daily changes in Buy Box owners over the past year:
Naturally, frequent changes in Buy Box prices are associated with highly competitive arenas. In our analysis, we’ve set out to back this intuitive hypothesis with concrete data. To that end, we’ve compared the frequency of price changes to three different metrics:
Effective competition level – Feedvisor’s internal calculation, reflecting the probability of obtaining the Buy Box for a given product at a given time.
Price wars level – Feedvisor’s internal calculation, reflecting the level at which price wars evolved for a given product at a given time.
Sales Rank – Amazon’s Sales Rank measure, based on the velocity of orders generated for a given product at a given time.
Results have shown strong correlations between the price change rate and each of these three metrics. In other words, we’ve found that a high price change rate is indeed a good indicator of a fast-selling, highly competitive product. Hence, sellers can leverage this data to better assess their products’ competitive state within these products’ overall life cycle. Specifically, they can utilize such data to enrich their replenishment decision process, helping them assess whether another round of selling a product will indeed turn out to be beneficial.
Often, sellers discover that their products’ life cycles become shorter over time, as demand on the marketplace grows. Frequent changes in prices will typically lead to a faster erosion of profit, which in turn will force sellers to halt their activity with existing products, and look for new ones to sell – faster than they had hoped for. It is therefore one of Feedvisor’s ongoing challenges to make sure its repricing technology will exploit the higher pricing levels of products before decreasing prices down to their lower bounds.